@madmikeisntmad:

Mad Mike Manchester
Mad Mike Manchester
Open In TikTok:
Region: GB
Monday 25 November 2024 21:45:19 GMT
1853
25
0
0

Music

Download

Comments

There are no more comments for this video.
To see more videos from user @madmikeisntmad, please go to the Tikwm homepage.

Other Videos

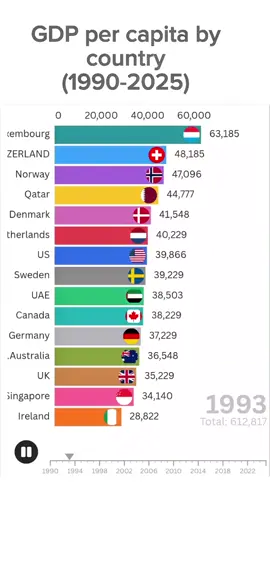
Ever wondered which countries truly got richer over time? 💸 From 1990 to 2025, this race bar chart reveals how the world’s GDP per capita evolved — showing the incredible economic rise of nations like the United States, China, Japan, Germany, and South Korea. 🌎 Each bar isn’t just a number — it’s a story of innovation, hard work, and transformation that reshaped the global economy. The U.S. remains a symbol of innovation and stability, leading the world with its advanced industries, massive tech sector, and strong currency. But what’s even more fascinating is the rise of countries like China and South Korea, who started the 1990s as developing economies and climbed their way into the ranks of global giants. 🇨🇳📈 From manufacturing powerhouses to technology leaders, their growth is nothing short of remarkable. Europe’s consistent economic performance also stands out — Germany, France, and the U.K. maintain high GDP per capita levels through industrial efficiency, innovation, and social stability. Meanwhile, oil-rich countries such as Saudi Arabia, the UAE, and Norway prove how resource management and diversification can drive massive wealth per citizen. 🌍💰 But it’s not just about the top — the developing nations tell a story of resilience. Countries like India, Indonesia, and Brazil show a steady rise in GDP per capita as their populations grow, industries expand, and global trade becomes more interconnected. 📊 Their improvement highlights the shift of global influence from traditional Western economies to emerging powerhouses in Asia and beyond. Across 35 years, this visualization captures everything — the dot-com boom, the 2008 financial crash, China’s manufacturing revolution, and the post-pandemic recovery. Each year adds a new chapter in the race for prosperity. Watch as economies rise, fall, and rise again, reminding us that wealth and power are never permanent — they move with innovation, leadership, and opportunity. From 1990’s industrial world to today’s digital-driven economy, this is a journey through history told through numbers and movement. The bar race makes it not only educational but visually addictive — you’ll literally see the evolution of global wealth unfold right before your eyes. ⚡ If you’re fascinated by world history, economics, or how nations build their fortunes, this is your video. The data tells a deeper truth — no country stays on top forever, but those that innovate always find their way back. Who do you think will dominate the next decade? 👇 #GDPGrowth #GlobalEconomy #usa  #WealthRace #usaudience   Keywords: GDP per capita, richest countries, wealth over time, global economy trends, data race visualization, economy by country, world growth 1990–2025, GDP ranking chart, U.S. vs China, richest nations 2025, data storytelling TikTok, economic history, economic rise of Asia, developed vs developing economies, financial growth, world economy analysis, richest economies chart, economic visualization, TikTok economy video.
Ever wondered which countries truly got richer over time? 💸 From 1990 to 2025, this race bar chart reveals how the world’s GDP per capita evolved — showing the incredible economic rise of nations like the United States, China, Japan, Germany, and South Korea. 🌎 Each bar isn’t just a number — it’s a story of innovation, hard work, and transformation that reshaped the global economy. The U.S. remains a symbol of innovation and stability, leading the world with its advanced industries, massive tech sector, and strong currency. But what’s even more fascinating is the rise of countries like China and South Korea, who started the 1990s as developing economies and climbed their way into the ranks of global giants. 🇨🇳📈 From manufacturing powerhouses to technology leaders, their growth is nothing short of remarkable. Europe’s consistent economic performance also stands out — Germany, France, and the U.K. maintain high GDP per capita levels through industrial efficiency, innovation, and social stability. Meanwhile, oil-rich countries such as Saudi Arabia, the UAE, and Norway prove how resource management and diversification can drive massive wealth per citizen. 🌍💰 But it’s not just about the top — the developing nations tell a story of resilience. Countries like India, Indonesia, and Brazil show a steady rise in GDP per capita as their populations grow, industries expand, and global trade becomes more interconnected. 📊 Their improvement highlights the shift of global influence from traditional Western economies to emerging powerhouses in Asia and beyond. Across 35 years, this visualization captures everything — the dot-com boom, the 2008 financial crash, China’s manufacturing revolution, and the post-pandemic recovery. Each year adds a new chapter in the race for prosperity. Watch as economies rise, fall, and rise again, reminding us that wealth and power are never permanent — they move with innovation, leadership, and opportunity. From 1990’s industrial world to today’s digital-driven economy, this is a journey through history told through numbers and movement. The bar race makes it not only educational but visually addictive — you’ll literally see the evolution of global wealth unfold right before your eyes. ⚡ If you’re fascinated by world history, economics, or how nations build their fortunes, this is your video. The data tells a deeper truth — no country stays on top forever, but those that innovate always find their way back. Who do you think will dominate the next decade? 👇 #GDPGrowth #GlobalEconomy #usa #WealthRace #usaudience Keywords: GDP per capita, richest countries, wealth over time, global economy trends, data race visualization, economy by country, world growth 1990–2025, GDP ranking chart, U.S. vs China, richest nations 2025, data storytelling TikTok, economic history, economic rise of Asia, developed vs developing economies, financial growth, world economy analysis, richest economies chart, economic visualization, TikTok economy video.

About